While most people generally think about the greenhouse effect and climate change in terms of “carbon emissions” and carbon dioxide (CO2), short-lived climate pollutants (SLCPs) have a more immediate effect on the Earth’s energy balance and play a significant role in global warming. While CO2 is the most prevalent and one of the longest lasting greenhouse gases (GHGs), it is not the most powerful. SLCPs generally have shorter atmospheric lifetimes than CO2 but have significantly larger capacities to absorb the infrared energy emitted by the earth, thereby warming the atmosphere. It is estimated that SLCPs account for 40–45% of the planetary warming experienced to date (roughly 1.1 degrees Celsius [°C] since 1880), and targeted efforts to reduce their emissions could slow the pace of global warming by 0.6°C by 2050. Given the need to reach carbon neutrality by the mid-21st Century to avoid a global temperature increase of more than 2°C, control of SLCP emissions will be essential.

Global Warming Potential
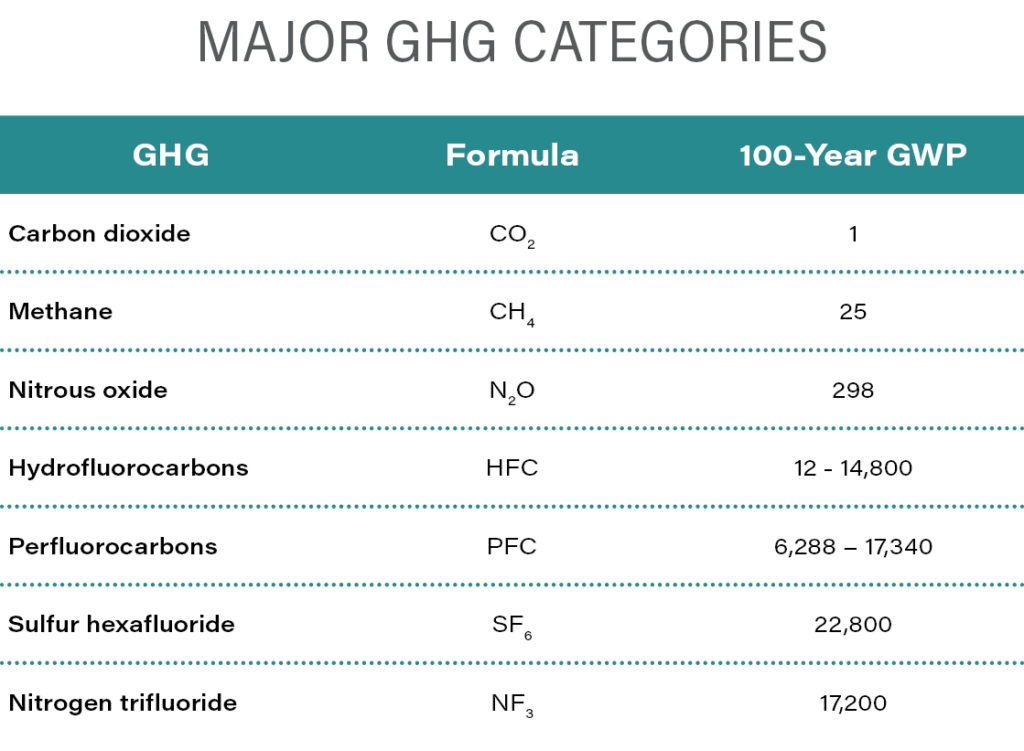
The atmospheric chemistry underlying the greenhouse effect of each GHG, usually referred to as “radiative forcing,” is complex and depends on the particular chemical compounds, their interactions in the atmosphere, and how long they remain in the atmosphere. In 1990, the United Nations Intergovernmental Panel on Climate Change established the concept of global warming potential (GWP) for GHGs. GWP is an index that incorporates both the direct effects of a gas on energy absorption in the atmospheric—its “radiative efficiency”—as well as how long the gas persists in the atmosphere, or its “lifetime.” Each trace atmospheric gas known to have a significant climate effect is assigned a GWP, which is used to weight the contribution of emission rates and atmospheric concentration of each gas to the aggregate climate impact. CO2 is the benchmark, with an assigned GWP value of 1. The GWPs of all other GHGs are multiples of that to indicate how much energy is absorbed by a ton of the gas in the atmosphere in a given period of time, relative to a ton of CO2. Their contributions are reported as CO2 equivalents or “CO2e.” The most commonly used GWP reference time period is 100 years, even though CO2 can remain in the atmosphere for thousands of years. Outlined in the 1998 Kyoto Protocol, six well-mixed (meaning uniformly distributed globally) GHGs, including CO2, methane (CH4), nitrous oxide (N2O), hydrofluorocarbons (HFCs), perfluorocarbons (PFCs), and sulfur hexafluoride (SF6), were chosen for international policy and regulatory focus because of a combination of their prevalence in the atmosphere as well as in commerce and their GWPs. A seventh gas, nitrogen trifluoride (NF3) was added in 2020. The 100-year GWPs for the seven major GHG categories used under the U.S. Environmental Protection Agency’s (EPA’s) Mandatory GHG Reporting Rule are tabulated below:
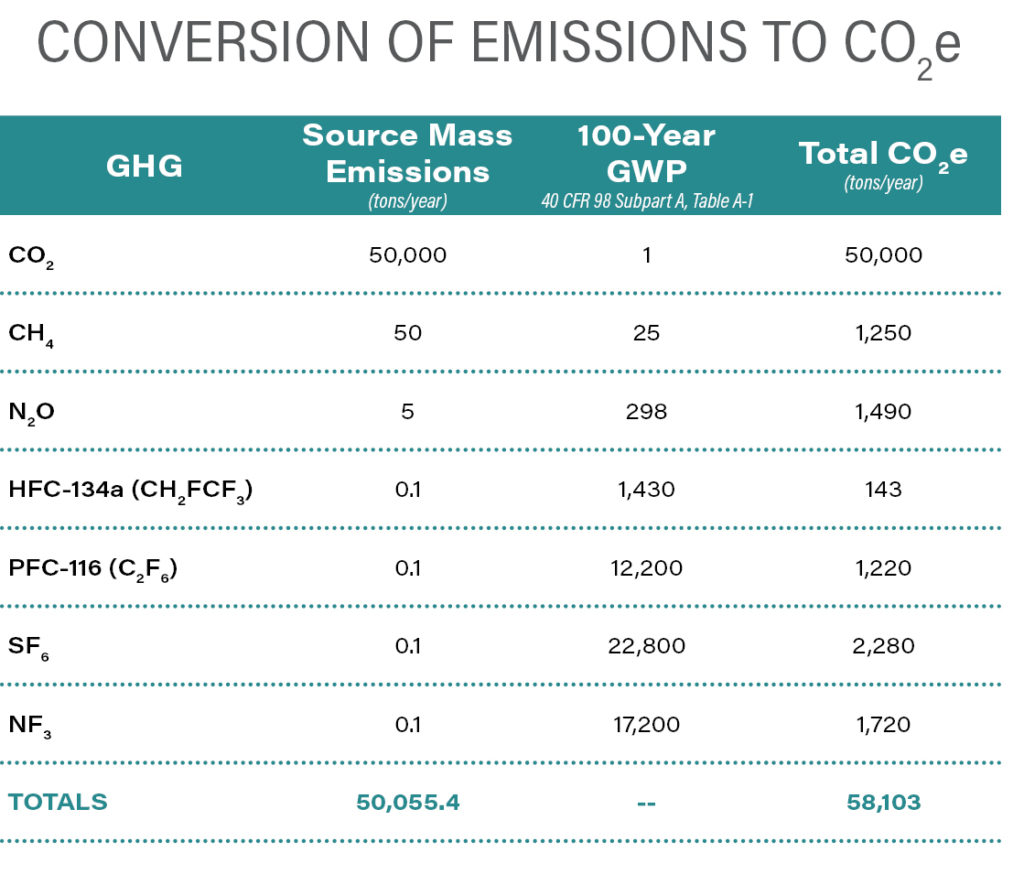
The next table illustrates how GWPs are used to convert mass emissions of the seven GHGs to CO2e.
The average lifetime of CH4 in the atmosphere is roughly a decade, but its 100-year GWP ranges from 25 to 30 because it absorbs much more energy than CO2. N2O, which arises from agriculture, fuel combustion, wastewater treatment, and various industrial sources, has a lifetime of over 100 years, and its estimated 100-year GWP is 298, indicating that a ton of N2O in the atmosphere absorbs nearly 300 times as much energy as a ton of CO2. HFCs and PFCs are families of fluorinated organic chemicals—HFCs have fluorine atoms partially substituted for hydrogen atoms, and PFCs have fluorine atoms completely substituted for hydrogen atoms. HFCs were developed as substitutes for ozone depleting substances (ODS) because they have similar thermodynamic properties but lower ozone depleting potentials (ODPs). PFCs are used in the production of many consumer products because of their unique properties and chemical stability. Both families of chemicals have 100-year GWPs ranging from thousands to tens of thousands of times that of CO2. According to EPA, HFCs have atmospheric lifetimes of up to about 260 years; however, most commercially used HFCs persist for less than 15 years. PFCs, because of their inherent chemical stability, persist in the atmosphere for tens of thousands of years. SF6, an industrial gas used for its insulative properties in high-voltage power systems and produced in the manufacture of electronics and magnesium, has a 100-year GWP of 22,800. It is the most potent GHG known and has an estimated atmospheric lifetime of 3,200 years. Fortunately, SF6 is synthetic, expensive, and well controlled. States such as California and Massachusetts regulate its use to limit emissions to the atmosphere, and EPA’s SF6 Emission Reduction Partnership for Electric Power Systems, established in 1999, has been successful in voluntarily controlling use and reducing emissions. NF3 is produced in the manufacture of various types of electronic components, and its production rate and measured concentration in the atmosphere are increasing. This is potentially problematic since it has a 100-year GWP of 17,200.
The United States distribution of emissions of the “the big three” GHGs (CO2, CH4, and N2O) as well as the combined fluorinated gases (SF6, NF3, HFCs, and PFCs) on a mass basis is shown in the following graphic.
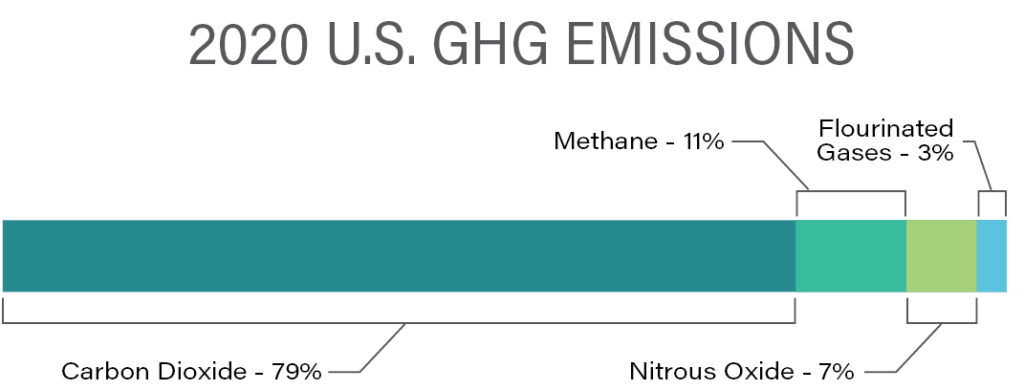
Source: U.S. Environmental Protection Agency (2022), Inventory of U.S. GHG Emissions and Sinks, 1990-2020
Short-Lived Climate Pollutants (SLCPs)
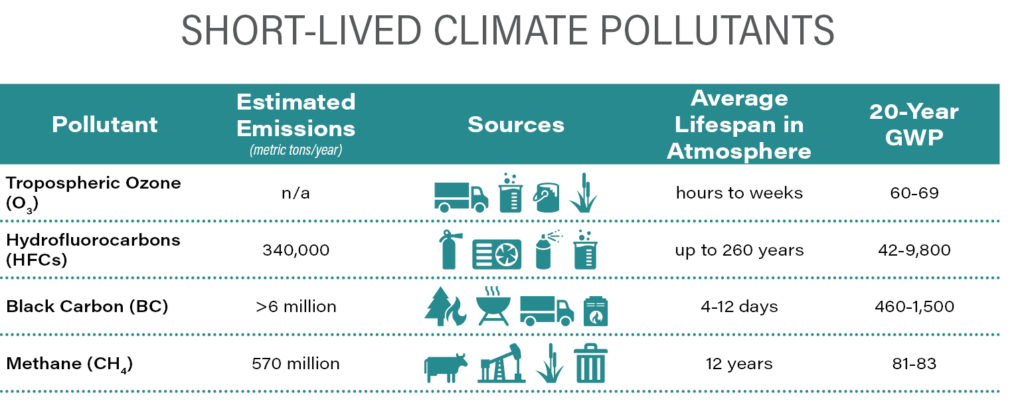
Although CO2 is by far the GHG emitted and present in the atmosphere in the greatest amount, reducing its rate of emission is particularly challenging because its primary source, fossil fuel combustion, underlies so many aspects of the global economy. In addition, the benefit of each ton not emitted or removed from the atmosphere has the lowest weighting of any GHG. With increasing awareness of the need to realize “net zero” carbon emissions by the mid-21st Century to avoid a global temperature increase of more than 2°C since pre-industrial times, it is clear that what happens in the next 30 years will be critical. For this reason, SLCPs, GHGs with generally shorter atmospheric lifetimes than CO2 but with considerably larger GWPs, are receiving increased policy making and regulatory focus. The SLCPs include tropospheric ozone (O3), HFCs, anthropogenic black carbon (BC), and CH4. Due to their relatively high GWPs, it is estimated that SLCPs have caused 40–45% of the planetary warming experienced to date and their continued emissions, although small on a mass basis in comparison to CO2 emissions, could offset the benefits of large-scale CO2 reduction programs. Targeted efforts to reduce SLCP emissions could slow the pace of global warming by 0.6°C by 2050.
Ozone (O3)
 O3 is present in the stratosphere, where it is fairly stable and protects terrestrial life from harmful ultraviolet solar radiation. It is also present in the troposphere where it is transient, regionally distributed, and classified as a criteria pollutant, subject to National Ambient Air Quality Standards (NAAQS). O3 is not emitted directly from anthropogenic sources at significant levels, but is formed in the stratosphere by photolytic decomposition of diatomic oxygen and in the troposphere as a product of chemical interactions between hydrocarbons (including CH4 ) and nitrogen oxides (NOX), both arising primarily from human activities. Interestingly, lightning is a natural source of ozone and its precursor NOX. However, recent research has shown that lightning also produces large amounts of hydroxyl radicals (OH–), which oxidize volatile organic compounds such as CH4 and other hydrocarbons, which are O3 precursors, thereby inhibiting ozone formation. In addition to strongly absorbing radiation (the 20-year GWP for O3 is estimated at 60-69), O3 also affects climate by impacting water evaporation rates, cloud formation, precipitation levels, and wind patterns. However, since stratospheric O3 is essential to protecting terrestrial life from harmful solar radiation, extant regulations focus on preserving it. Tropospheric O3, which is a more immediate human health risk as a conventional pollutant than as a GHG, is regulated aggressively under the NAAQS in the United States as a criteria pollutant. This is largely true in other industrialized nations.
Hydrofluorocarbons (HFCs)
HFCs are fluorinated hydrocarbons, which have no natural sources. They are used primarily as refrigerants, but also in aerosol products, foam blowing, solvents, and fire suppression. They were developed as substitutes for ODS such as chlorofluorocarbons (CFCs) and hydrochlorofluorocarbons (HCFCs), which are being phased out because of their high ODPs, but many HFCs have high GWPs. The most abundant HFC is the refrigerant HFC-134a, which has a GWP approximately 1,300 times that of CO2. Global installed refrigeration capacity has roughly tripled since 2000, and affects the climate directly through inadvertent release of high GWP working fluids and indirectly through increased demand for what is often fossil carbon-based electricity. Because of the climate impact potential of HFCs, on 15 October 2016, 197 countries, including the United States, adopted the Kigali Amendment to the Montreal Protocol on Substances that Deplete the Ozone Layer, which committed signatories to cut production and consumption of HFCs by more than 80% over the following 30 years. EPA rules limiting HFCs, promulgated pursuant to the treaty, were challenged and overturned in U.S. Federal court in 2017 but have since been replaced by new regulations effective in 2022. EPA estimates that these regulations will eliminate approximately 4.6 billion metric tons of CO2e emissions in the form of HFCs between 2022 and 2050. As with previous ODS regulations, the new rule phases down production and consumption of HFCs (85% in the United States in 15 years), manages their use to maximize reclamation and minimize releases to the atmosphere, and facilitates transition to lower GWP substitutes. Many member states of the U.S. Climate Alliance, also have more focused HFC regulations implemented during the time when the US had opted out of the Paris Agreement (between 2016 and 2020). One anticipated replacement for HFCs is low-GWP hydrofluoroolefins (HFOs). These are being engineered as “drop-in” replacements for legacy refrigerants and are already in production. According to EPA, global HFC phase down resulting from the new regulations could prevent up to 0.5°C warming between now and 2100.
Black Carbon (BC)
Anthropogenic BC, sometimes called soot, arises primarily from incomplete combustion of carbon in fuels. It is a complex mixture of elemental carbon and organic forms of carbon, generally suspended as fine particulate matter (PM2.5) in the atmosphere, where it absorbs sunlight and converts it to heat, interferes with cloud formation, accelerates melting of snow and ice, and reduces plant productivity and the attendant uptake of atmospheric CO2. The largest sources of BC are fossil fuel and solid waste combustion; however, wildfires also contribute. The Climate & Clean Air Coalition estimates that annual global emissions of BC exceed 6 million metric tons, that BC has a GWP ranging from 460 to 1,500, but that it typically persists in the atmosphere for only between 4 and 12 days. Hence, reduction of BC emissions can provide some of the most immediate benefits for reducing climate impacts. The largest source (about half) of BC worldwide is home heating and cooking using solid fuels (i.e., wood, charcoal, biomass, and animal dung). The World Health Organization also estimates that PM2.5 from cooking indoors with solid fuels results in roughly 2 million deaths per year worldwide. In the United States and other industrialized countries, use of solid fuels for heating and cooking is less prevalent and emissions from solid fuel home heating appliances such as woodstoves and fireplace inserts are regulated. In addition, many industrial and commercial sources of BC, such as diesel engines and furnaces, are regulated as sources of both criteria and hazardous air pollutants, which generally pose a more immediate human health risk than do GHGs. Open burning, whether agricultural waste, land-clearing debris, municipal solid waste, or controlled burning of forest land, which account for approximately 40% of U.S. BC emissions, is much more challenging to mitigate and the only feasible solution may be restrictions or bans on these practices. The opportunities for BC emissions mitigation in developing countries include all of those employed in developed countries, as well as upgrading home heating and cooking appliances to burn cleaner, more efficient (non-solid) fuels. As with controlling other climate pollutants emitted in developing nations, financial, technical, and implementation assistance from developed nations may be necessary to realize these opportunities for reduction by mid-century.

Methane (CH4)
CH4 emissions to the atmosphere arise from both natural and anthropogenic sources. Natural sources include anaerobic decay of organic matter in wetlands, enteric fermentation in wild ruminant animals, and deep ocean thermogenesis. Human activities that release CH4 to the atmosphere include agriculture, enteric fermentation in domestic ruminant animals, oil and natural gas production, solid waste landfills, and wastewater treatment. Globally, human activities account for between half and two-thirds of current CH4 emissions and the measured concentration of CH4 in the atmosphere is increasing. The International Energy Agency estimates annual CH4 emissions to the atmosphere to be approximately 570 million metric tons, of which roughly 40% arise from natural sources and 60% from human activities. On a 20‑year time horizon, the GWP of CH4 is 81–83 times greater than CO2. In addition to absorbing infrared radiation, CH4 increases ozone pollution and reduces agricultural productivity, both detrimental to the climate. Among the challenges associated with mitigating CH4 emissions has been identification of sources and quantification of emissions. However, recent advances in remote sensing, including satellite imagery and terrestrial optical gas imaging, have greatly improved the ability to detect, measure, and quantify fugitive emissions of CH4.
EPA’s current estimate of the United States’ distribution of CH4 emissions is shown in the following graphic.
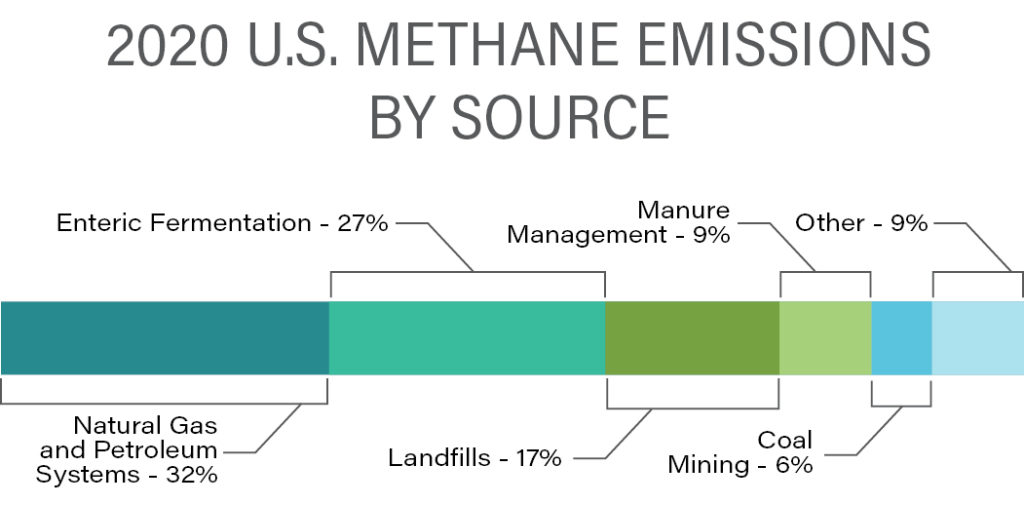
Source: U.S. Environmental Protection Agency (2022), Inventory of U.S. GHG Emissions and Sinks, 1990-2020
The largest single anthropogenic source of CH4, livestock agriculture, includes both raising ruminant animals (enteric fermentation) and managing their manure, which together comprises approximately 36% of the total. There are several technologies in development, such as feed additives, to reduce the amount of CH4 produced by ruminants, and animal manure can be anaerobically digested in containment vessels producing CH4, which can be captured for use as fuel gas.
According to EPA estimates, a close second to agriculture is natural gas and oil extraction, processing, and delivery to market. Contributions from the various industry sectors are summarized in the following graphic.
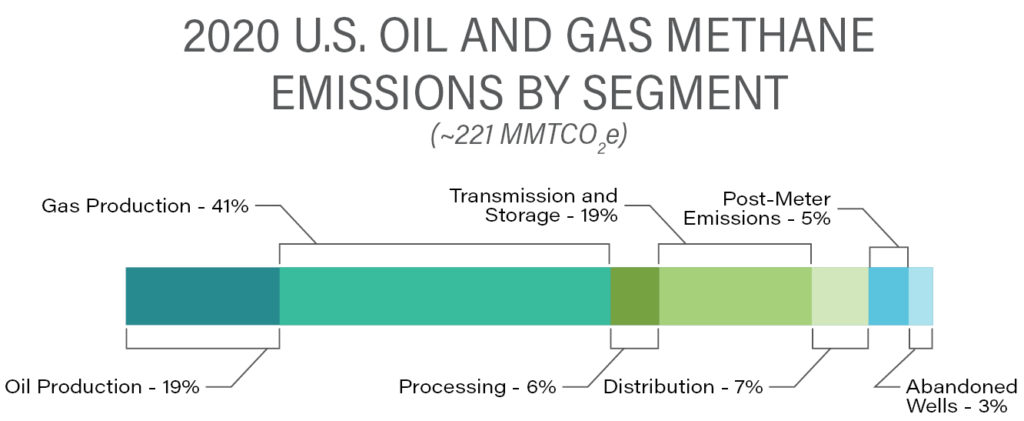
Source: U.S. Environmental Protection Agency (2022), Inventory of U.S. GHG Emissions and Sinks, 1990-2020
Many of the sources of CH4 from the oil and gas industry are controlled through regulation under the Clean Air Act and similar statutes in other developed countries. However, much of the CH4 leakage from the natural gas value chain arises from lax operation of production facilities and an aging transmission and distribution infrastructure. Recent independent estimates of fugitive CH4 emissions from this sector have shown that leakage rates may be considerably larger than previously estimated by EPA [1], [2],[3]. As a result, recently passed federal legislation (IIJA/IRA) will impose significant economic penalties on oil and gas industry operators for CH4 emissions that exceed established thresholds.
The third largest anthropogenic source of CH4 is from the treatment of solid waste and wastewater, which is subject to regulation under the Clean Air Act. A number of states are also imposing more stringent regulations to further limit CH4 from these sources.
One of the most effective means of reducing CH4 release as a climate pollutant is capturing it and utilizing it as a clean fuel. This applies both to effectively containing natural gas during its production, transmission, and distribution and to the capture of biogas, a mixture primarily of CH4 and CO2, in which the CH4 content ranges from approximately 45 to 75%. An increasingly common practice is to capture biogas, which is generated by decomposing waste in a landfill, anaerobic digestion of biosolids in a wastewater treatment operation, or anaerobic processing of livestock manure. The biogas can be used directly on-site to generate renewable electricity or to displace purchased natural gas used as a fuel, or alternatively upgraded to pipeline quality, then known as renewable natural gas (RNG), and delivered to the natural gas distribution grid. RNG is eligible for credits under the U.S. Federal Renewable Fuels Program and various state low carbon fuel standards. The carbon emissions from burning biogas or RNG are considered “biogenic,” meaning carbon coming from the biosphere within years or decades, rather than fossilized carbon that has been buried in the lithosphere for hundreds of millions of years. Biogenic carbon is generally considered carbon neutral; however, EPA has not made a final decision on if and how it will be regulated.

Wusel007, CC BY-SA 3.0 via Wikimedia Commons
A potentially significant aspect of CH4 as a climate pollutant is the presence of huge natural reserves in the form of methane hydrates. Different from CH4 trapped in geological strata as natural gas, which is largely secure from release in the absence of human intervention, methane hydrates (or clathrates) are a unique solid form of CH4 bound together with water in a dense crystalline structure like ice. One cubic meter of methane hydrate could produce roughly 160 cubic meters of CH4 gas. As with most natural sources of CH4, these hydrates were initially formed from the anaerobic decomposition of organic matter hundreds of millions of years ago. The crystalline structure is maintained by extreme conditions of high pressure and/or low temperature. They are found in deep marine sediments and, to a lesser extent, in polar permafrost layers. According to the U.S. Department of Energy (DOE), the amount of CH4 contained in methane hydrate deposits is estimated to be between 90 and 250 times the amount of CH4 present in recoverable natural gas deposits. Continued warming could at some point potentially release much of the carbon sequestered in methane hydrates. However, recent U.S. Geological Survey research indicates that a rapid release leading to a significant increase in atmospheric CH4 concentration from methane hydrates is unlikely.
Conclusions
SLCPs as a group (O3, HFCs, BC, and CH4) have accounted for a significant fraction of the planetary warming already experienced; and, if they are not aggressively abated, their emissions will be a significant barrier to achieving global carbon neutrality by the mid-21st Century and avoiding a global temperature increase of more than 2°C since pre-industrial times.
Ozone
Tropospheric O3, present primarily due to emissions of its precursors (NOX and volatile organic compounds), is aggressively regulated as a criteria pollutant and the associated U.S. NAAQS, most recently strengthened in 2015, is being considered for further reduction. Additional actions taken to reduce tropospheric ozone pollution to protect human health and welfare will also reduce its radiative forcing effect in the atmosphere.
HFCs
Use of HFCs (originally a substitute for CFCs and HCFCs) is being phased out under the Kigali Amendment to the Montreal Protocol and under new EPA rules (2022) pursuant to that treaty. Owners and operators of processes using HFCs can accelerate the reduction of their associated carbon footprint by voluntarily switching to lower-GWP substitutes, such as HFOs in advance of regulatorily mandated schedules.
Black Carbon
BC is a component of fine PM2.5, a conventional pollutant long regulated due to its adverse human health effects. Knowledge of the climate effects of BC emissions is more recent. Developed nations generally have regulations that control BC emissions from large and small point sources, and use of solid fuel for home heating and cooking is uncommon. However, upgrading home heating and cooking appliances in developing countries to burn cleaner (non-solid) fuels more efficiently represents a significant opportunity to reduce the radiative forcing effect of BC in the atmosphere. In all countries, aggressive electrification of fleets and buildings, along with conversion to renewable energy sources, such as solar, wind, wave, etc., will reduce burning of fossil fuels and its resulting BC emissions. In addition, finding substitutes for controlled burning of forests and for open burning of organic waste (such as composting and anaerobic digestion) could also significantly reduce BC climate impacts.
Methane
CH4 emissions are estimated to have caused roughly one-third of the global warming experienced to date. Given the wide distribution of human and natural sources of CH4, including vast natural reservoirs, as well as the various potential means of mitigating emissions, CH4 probably represents the greatest challenge/opportunity among the SLCPs. Finding effective ways of reducing CH4 emissions to the atmosphere between now and mid-century will be critically important. The most significant opportunities to decrease CH4 emissions include:
- Reducing CH4 emissions from agricultural production
- Reducing or eliminating fugitive emissions from oil and gas production, processing, and distribution
- Reducing fugitive emissions from anaerobic decomposition of organic matter (i.e., solid waste in landfills and biosolids in wastewater)
- Deliberately employing anaerobic digestion to process organic waste materials, with subsequent recovery of CH4 and cleanup for use as gaseous, biogenic carbon fuel
Opportunities
In general, increased awareness of the nature and sources of SLCPs, particularly those subject to emerging/developing regulations, will help to improve mitigation efforts. Ozone and PM2.5 have been regulated aggressively as conventional air pollutants for over 50 years, and this regulatory approach will continue to dominate. As with ODS before them, phase-out of production and sale of HFCs by regulatory deadlines will largely be the responsibility of manufacturers and distributors. However, HFC users are free to implement lower GWP substitutes as soon as they are commercially available, to more aggressively reduce emissions and their effect on the organization’s carbon footprint. Some sources of BC emissions, such as open burning and wildfires, interfere with attainment of the PM2.5 NAAQS that are currently being considered for further reduction by EPA. Consequently, more aggressive control/regulation of these sources may be needed to both attain the NAAQS and to further mitigate the climate impacts of the BC emissions.
Given the large and rising magnitude of CH4 emissions to the atmosphere and the fact that it has both natural and many and varied anthropogenic sources, CH4 presents the greatest single opportunity for SLCP impact reduction. Using new and innovative ways to quantify and reduce emissions from agriculture, fuel processing and usage, and disposal of solid waste will be key to realizing these reductions.
 For more information, contact:
John Kumm, P.E., BCEE, CC-P, CEM, LEED AP
Senior Engineer/Senior Project Manager
Contact Us