Near-term climate change is likely to impact environmental and engineering services industry
In June, the World Meteorological Organization (WMO) Lead Centre for Annual-to-Decadal Climate Prediction issued the 2024 to 2028 climate forecast. The mainstream media focused their coverage on the high chance that global average temperature in the next 5 years (2024 to 2028) will breach 1.5 degrees Celsius (oC) or 2.7 degrees Fahrenheit (oF) warming when compared to the benchmark pre-industrial period (years prior to 1850). This threshold is the target warming cap set in global policies to avoid disruptive weather changes. This article highlights risks to the environmental and engineering services industry which are expected to emerge should the threshold be exceeded. The potential weather hazards relevant to the environmental and engineering services industry include the following:
- Summer temperature 1.1 to 2.2 oC (2 to 4oF) above average across continental United States
- Winter temperature 1.6 to 3.3 oC (3 to 6oF) above average in Alaska and Canada
- Increase in frequency of hot days in the summer and freeze-thaw cycles in fall, winter, and spring across continental United States, Alaska, and Canada
- Decrease in frequency of cool nights during summer in the southern United States
- Increase in amount of rainfall on extreme rainfall days by 5 to 20 percent across continental United States
- Predicted conditions in the North Atlantic for May through September 2024 to 2028, indicate above-average tropical storm activity
- Predicted rate of temperature increase as much as three times the global temperature rate of increase for the northern United States and northward to the Arctic over the next five winters (November to March)
A risk summary is provided below for the environmental and engineering service industry (hereafter, the industry). For those who want to learn more about 10-year climate forecasts as a new technique with potential applications for the industry, technical information is provided following the risk summary.
Potential Impacts
The industry could be affected in a wide range of site-specific, programmatic, and market elements, which would impact the work we execute and the way we operate from 2024 through 2028. The section below applies the 10-year climate forecasts to many facets of the industry and notes the potential changes and considerations.
Field Safety
Higher temperatures and frequency of hot days means that there will be more days when field workers will be susceptible to heat stress. Additionally, higher amounts of rainfall during extreme rainfall days, means workers may experience flash flooding and other water-related hazards. Safety planning should consider these changing conditions. In northern climates, less stable ice in the shoulder seasons, acceleration of permafrost loss, and invasive pests as well as longer seasons for pests like mosquitos, are considerations for the safety of field workers.
Engineering and Construction
More frequent and intense precipitation events, means that active construction efforts will be more susceptible to weather-related impacts before final stabilization and closure conditions are met. This is especially true for projects that have a water resource nexus. These concerns are heightened along the Atlantic and Gulf Coast due to the calibrated forecast of more active tropical storm seasons. The intensity and duration of more frequent weather-related events is a current reality exposing the challenges related to infrastructure design and capacity in a new era. In northern climates, soil thaw cycles are expected to be more frequent, impacting the stability of roads (paved and rock), surfaces with large equipment on them, and slopes. Underground structures may be subject to changing soil loads through soil expansion and contraction cycles as permafrost is replaced with soils that alternate between wet and dry.
Ecological Response
The growing season is expected to continue to lengthen compared to the past decade, with greater impacts in northern compared to southern latitudes. Spring greening will continue to occur earlier in the calendar year in all regions. Summer vegetative water stress will have more frequent acute periods, particularly across the western two-thirds of the United States. Some pests and invasive vegetative species may be able to overwinter farther north than during the previous decade. Atlantic and Gulf Coast ecosystems will continue to be damaged and stressed due to more frequent tropical storms and hurricanes.
Regulatory Permitting
As noted above, challenges with under-designed and constructed infrastructure will become more prevalent. We are already seeing permitted and constructed sites experiencing rainfall intensity exceeding the thresholds to which the site was designed and the requirements of any permitting (i.e., some sites permitted based on the model of a 100-year rainfall event may a 200-year or even more rare event). The exact sites cannot be predicted ahead of time due to the chaotic nature of weather systems, but the trend of more rainfall during extreme rainfall events has been consistent for the past two decades, is forecast to accelerate in the next 5 years, and is not incorporated fully into some current permitting procedures. Resilience design will become more important.
Power Usage and Greenhouse Gas Emissions
Associated with changing climatic conditions, built infrastructure energy use during warm seasons will likely increase significantly, which can impact carbon footprint and emissions. Yet, the potential to reforest and use other methods of carbon sequestration could also increase in capacity and become more available as offsets to fossil-fuel energy use and fossil carbon emissions.
Environmental Justice
Low-income communities and disadvantaged communities will be most vulnerable to the effects of changes in climate. Given the potential for increasing number of days with temperatures that could causer heat illnesses and the mobilization of contaminants arising from excessively rainy days and changing groundwater levels, there is an immediate need to develop adaptive capacity in these communities that is greater compared to the previous decade.
Summary
This 10-year climate forecast provides the industry with guidance on the pace of climate change. In particular, a global warming permanently exceeding 1.5oC (2.7oF) is possible within the next 5 years. The information is inherently interdisciplinary, as the level of risk to climate change may be updated through qualitative, categorical risk or quantitative risk calculations. This means planners and managers may integrate this risk information into timelines; engineering methods may update probabilities and cost-benefit analysis; and adaptable infrastructure, like nature-based solutions, may be reviewed and, if warranted, adjusted.
Technical Description of 10-Year Climate Forecasts
Below is background information on technical aspects of 10-year climate forecasts to explain how they differ from climate-change scenarios used in resilience planning. This new capability from climate science is a rapidly emerging, applied science that can provide guidance to the industry on adaptive management for climate change. Adaptive management is widely used in environmental engineering (termed observational method by the engineering community), natural resource management, and nature-based solutions to climate change.
A key difference between climate change projections and 10-year climate forecasts is in the way the changing ocean conditions are incorporated. For example, El Niño is an ocean circulation widely reported by popular media that has an impact on weather. El Niño varies over 1- to 3-year time windows, which weather predictions use to provide forecasts of weather statistics 3 months to 1 year in advance (such as, a March forecast for the number of hurricanes in the Atlantic tropical storm season in June to September, or a September forecast for the number of atmospheric rivers along the West Coast in November through March). Some ocean circulations vary along 10- to 30-year time windows. For the decadal ocean conditions, this means weather predictions can provide forecasts of weather statistics 5 to 20 years in advance.
A 10-year climate forecast uses the current ocean conditions and predicts its evolution over the next 5- to 20-year period. A climate change scenario does not use the current ocean condition. Instead, an estimate of the ocean condition in the mid-1800s is used, which is the approximate starting point for human-caused climate change. The model then predicts the ocean evolution for the next 150 years or more. In a climate change scenario, the ocean condition in the climate model prediction in 2024 may not be similar to the actual ocean condition in that year. The climate change scenario provides the widest range of potential weather over all possible ocean conditions in 2024. Because the 10-year climate forecast depends on the currently observed ocean conditions, the range of potential weather conditions is smaller compared to climate change projection.
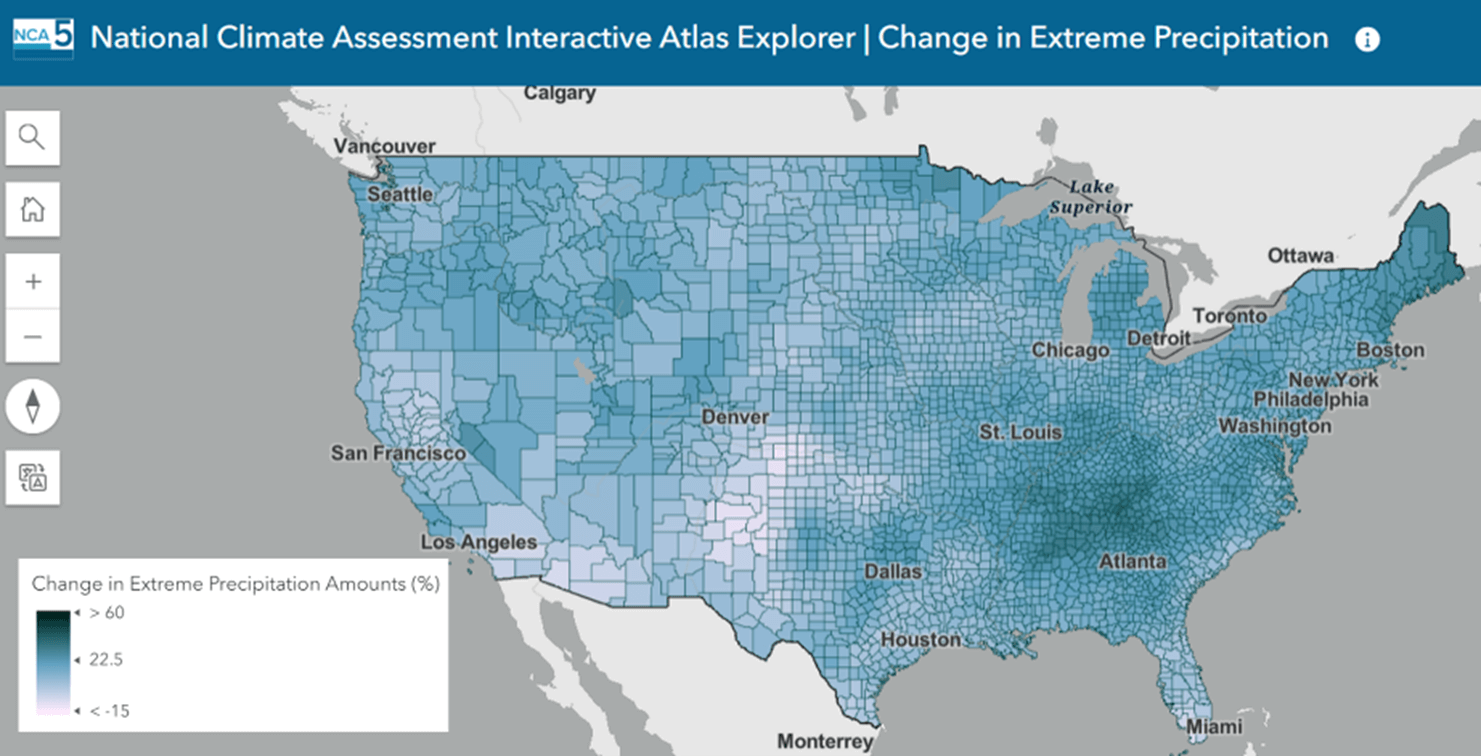
Climate change projections are distributed by The National Climate Assessment 5 (NCA5) data atlas. Climate statistics are conditioned upon the global average temperature permanently exceeding pre-industrial global average temperature by certain amounts. The atlas offers maps and CSV files of weather statistics for thresholds of 1.5, 2.0, 3.0, and 4.0oC (2.7, 3.6, 5.4, and 7.2oF). For example, the maps below illustrate change in (a) extreme precipitation and (b) summer average temperature when 1.5°C (2.7oF) warming is permanently exceeded.

Extreme precipitation when 1.5oC (2.7oF) warming is permanently exceeded. Credit: Fifth National Climate Assessment Atlas, Creative Commons 4.0

Summer average temperature when 1.5oC (2.7oF) warming is permanently exceeded. Credit: Fifth National Climate Assessment Atlas, Creative Commons 4.0
The map data describes an increase in extreme precipitation by 20 percent across the eastern two-thirds of the United States. Across the southeast United States, summer average temperature will increase by 2.2oC to 3.3oC (4 to 6oF). However, the years in which these extreme events will occur will be indeterminant.
The power of the WMO 10-year forecast is that the year is no longer indeterminant! Instead, the 10-year climate forecast contains a 50 percent probability of occurrence during 2024 through 2028. Since the forecast is calibrated by historical data, decision makers can have greater confidence that the probability is accurate and reliable.
 For More Information, Contact:
Chris Anderson, PhD
Director, Climate Services
Email Chris
Contact Us
