In collaboration with the Central Platte and Lower Loup Natural Resource Districts (NRDs) in Nebraska, EA conducted a study to determine cover crop effects on groundwater recharge to support informed management decision-making regarding the promotion of cover crops as a conservation practice. Specifically, the study evaluated the impacts of cover crops on potential groundwater recharge and vertical movement of nitrates through the crop’s root zone. The results enable the districts to evaluate how cover crops are working and what changes they should make to implementation.
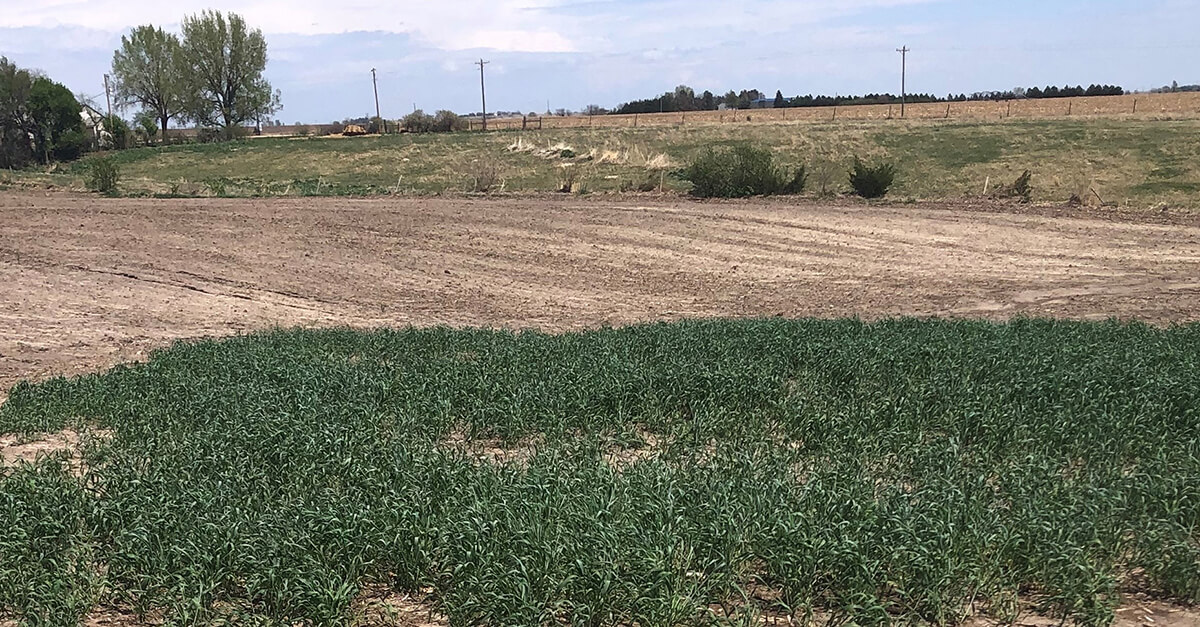
Cover crops are crops that are primarily planted to cover soil rather than for the purpose of being harvested. They are planted during the non-growing season (from fall to winter) and are terminated in early spring before the next planting season. Cover crops also help increase soil organic carbon, reduce soil erosion, suppress weed growth, control insect populations, increase infiltration rate, and reduce nitrogen leaching. However, there is limited information that quantifies the impact of cover crops on groundwater recharge. Cereal rye and turnips are common cover crops in Nebraska.
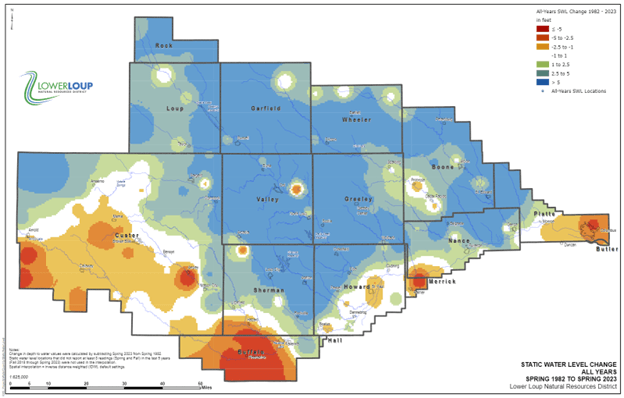
Many areas in Nebraska report heightened nitrate levels in groundwater and a decline in static water levels. Annual static water level monitoring in central Nebraska shows up to a 5-foot decline in certain areas in the last decade.
Methods
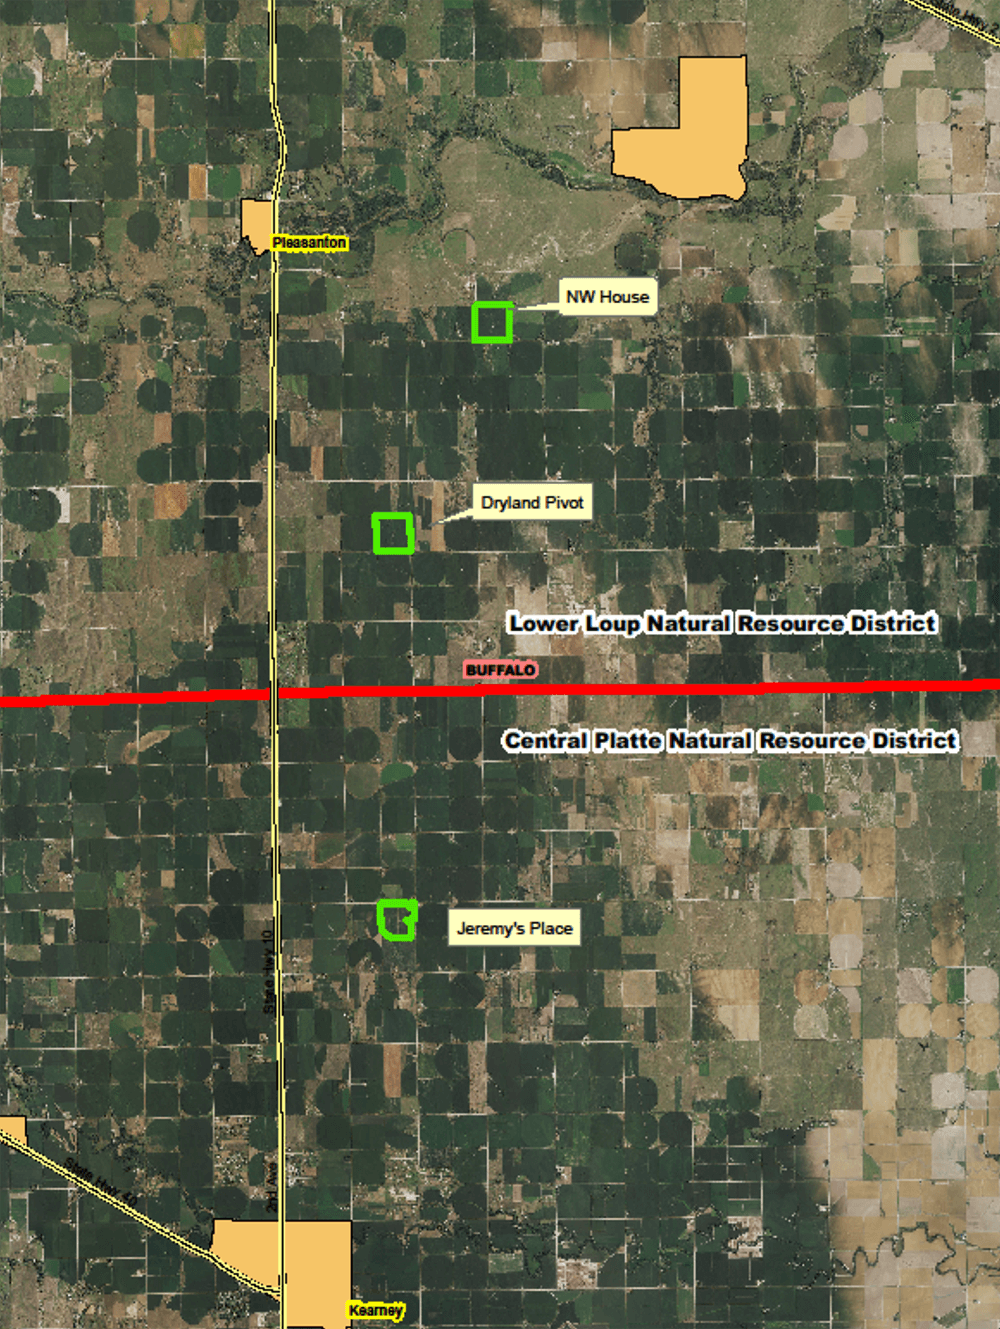
EA staff conducted a literature review and found a significant gap in studies examining the relationship between cover crops and nitrate leaching, soil moisture, infiltration rates, and groundwater recharge potential. The NRDs received a Water Sustainability Fund grant from the Nebraska Department of Natural Resources to study cover crop effects on groundwater recharge in the area between the South Loup River and Wood River, which has been experiencing groundwater level decline.
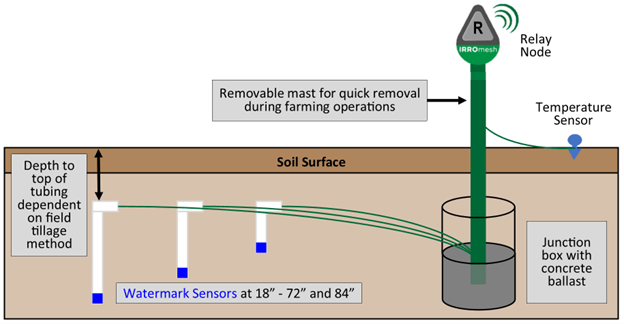
Next, EA selected 3 crop fields in the region that met various criteria: representative soil types and cover cropping systems, landowners willing to manage cover crops and allow access for 3 years, irrigated fields, and areas approximately 160 acres in size. The 3 fields selected for sampling were Jeremy’s Place, Dryland Pivot, and NW of House. The fields were then split in half with one side being planted with cereal rye and the other half left unplanted. As can be seen in the figure below, 4 paired nodes with moisture sensors were placed in each of the 3 fields to assess soil infiltration as potential recharge. Cellular base stations for telemetry and rainfall sensors were placed on pivots. All the monitoring nodes communicated with the bases that uploaded data on soil moisture and soil temperature to a website.
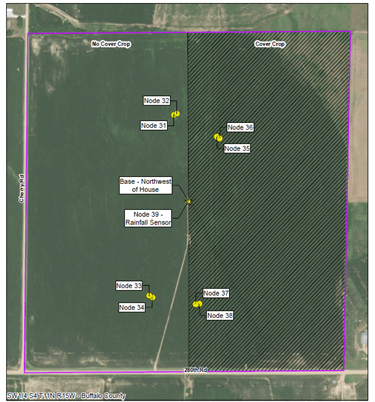
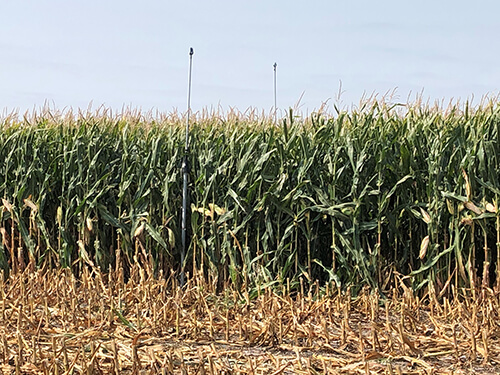 Data collection nodes were placed on masts so they could communicate via line-of-site on top of the corn plant canopy. Each mast had 3 sensors at various depths: 18 inches (representing the root zone), 72 inches (representing the bottom of the root zone), and 84 inches (representing below the root zone). The sensors were installed for the first time in November 2019, and then were removed and installed before and after harvest and planting each year till 2022. Data points were collected every 30 minutes over this study period, yielding approximately 4 million data points.
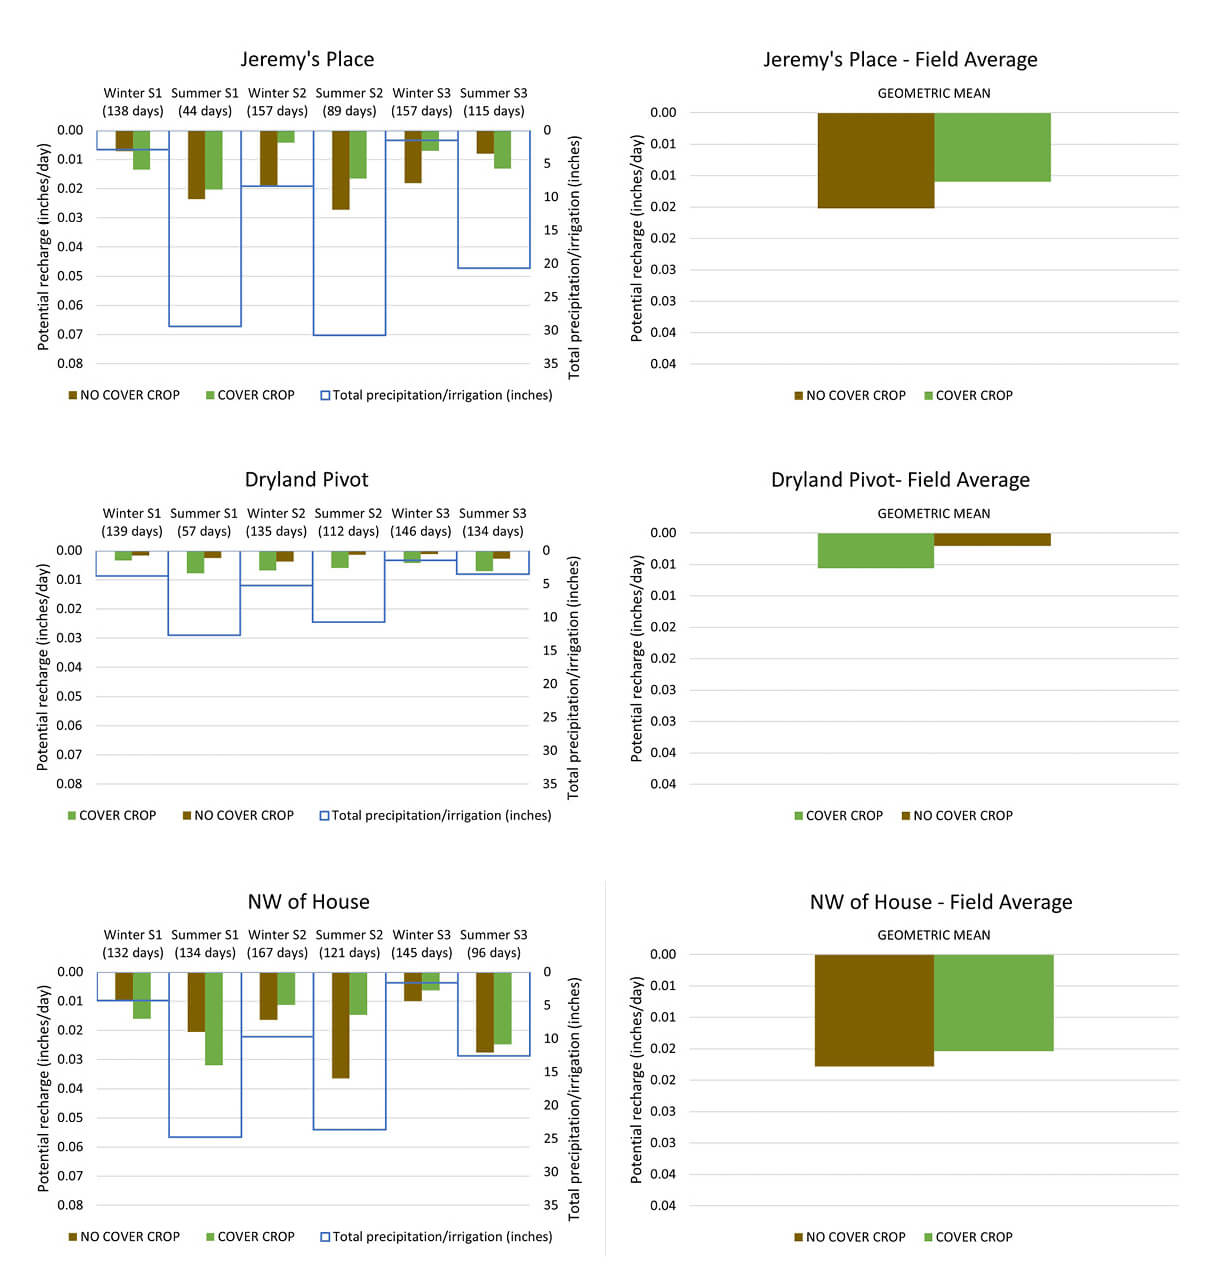
Following data compilation, two influential parameters (the van Genuchten function and unsaturated hydraulic conductivity) were employed to calculate potential recharge (inches/day). Mean recharge values were compared to determine whether recharge was significantly different (p<0.1) between areas with and without cover crops.
Results
At Jeremy’s Place and NW of House, no statistically significant difference in potential groundwater recharge (inches/day) was observed between the cover crop and non-cover crop areas on either a seasonal or annual basis. At Dryland Pivot, a significant difference in groundwater recharge was observed between cover crop and no cover crop areas on both a seasonal and annual basis, with more potential recharge observed in areas with cover crops.
Soil nitrate samples were also collected through the vadose zone (up to 15 feet of depth) using a Giddings Rig soil probe in 2019, 2020, and 2022. Statistically significant differences in soil nitrate (pound/acre) between cover crop and no cover crop areas were observed at Dryland Pivot in 2019 and Jeremy’s Place in 2020. Soil nitrate levels were significantly different between the surface depth (0-3 feet) and other depths (3-15 feet) in Dryland Pivot in 2022 and between 0-6 and 6-15 feet in NW of House in 2019.
Conclusions
When all fields are combined for the entire project duration, there is no statistical difference in potential groundwater recharge between areas with cover crop and no cover crop. For groundwater recharge, there is either no disadvantage or potential minor advantage to planting cover crops.
For soil nitrate levels, there was an overall decrease in soil nitrate from 2019 to 2022. There was no statistical difference in soil nitrate between areas planted with cover crops and no cover crops.
Researchers acknowledge that management decisions such as nutrient application (commercial fertilizer, manure, etc.), tillage, irrigation, field operations, and grazing were not controlled between fields and could have potential impacts on groundwater recharge.
There are other NRDs interested in doing cover crop studies of this nature and EA looks forward to continuing this research with lessons learned from this project.

For more information on cover crop studies, please contact:
Dan Bigbee, PWS, CERP, Program Manager/Senior Environmental Scientist
402-817-7612
Contact Us