Conferences/News
Office Locations
Apply for Jobs
EA on Social Media
Contact Us
Home
Markets/Services
Subcontractors/Suppliers
Insights
Careers
About EA
×
×
Who We Are
Markets
Federal
State and Municipal
Industry
Services
Chemicals and Contaminants of Emerging Concern
Climate Change
Coastal Resilience
Contaminated Site Assessment and Remediation
Data Management and Technology
Ecotoxicology Laboratory
Engineering Services
Environmental, Health, and Safety Management and Assurance
EnviTreat Laboratory
Infrastructure Project Support
Munitions Response
Natural Resources Management
Sediment Management
Sustainable Solutions
×
×
About EA
About EA
President's Message
Core Ideology
Our History and Commitment
Corporate Sustainability
Community Support
Safety and Health
Professional Corporations/Affiliates
×
×
Careers
Careers
Join Our Team!
Employee-Owned Public Benefit Corporation
Collaboration and Self Development
Your Career at EA
Work-Life Balance
Great Benefits
Your Path to a New Career
The Future
×
×
Subcontractors/Suppliers
Subcontractors/Suppliers
Doing Business with EA
Supplier Program
Search in https://eaest.com/
×
×
Home
Markets/Services
Subcontractors/Suppliers
Insights
Careers
About EA
Conferences/News
Office Locations
Apply for Jobs
EA on Social Media
Contact Us
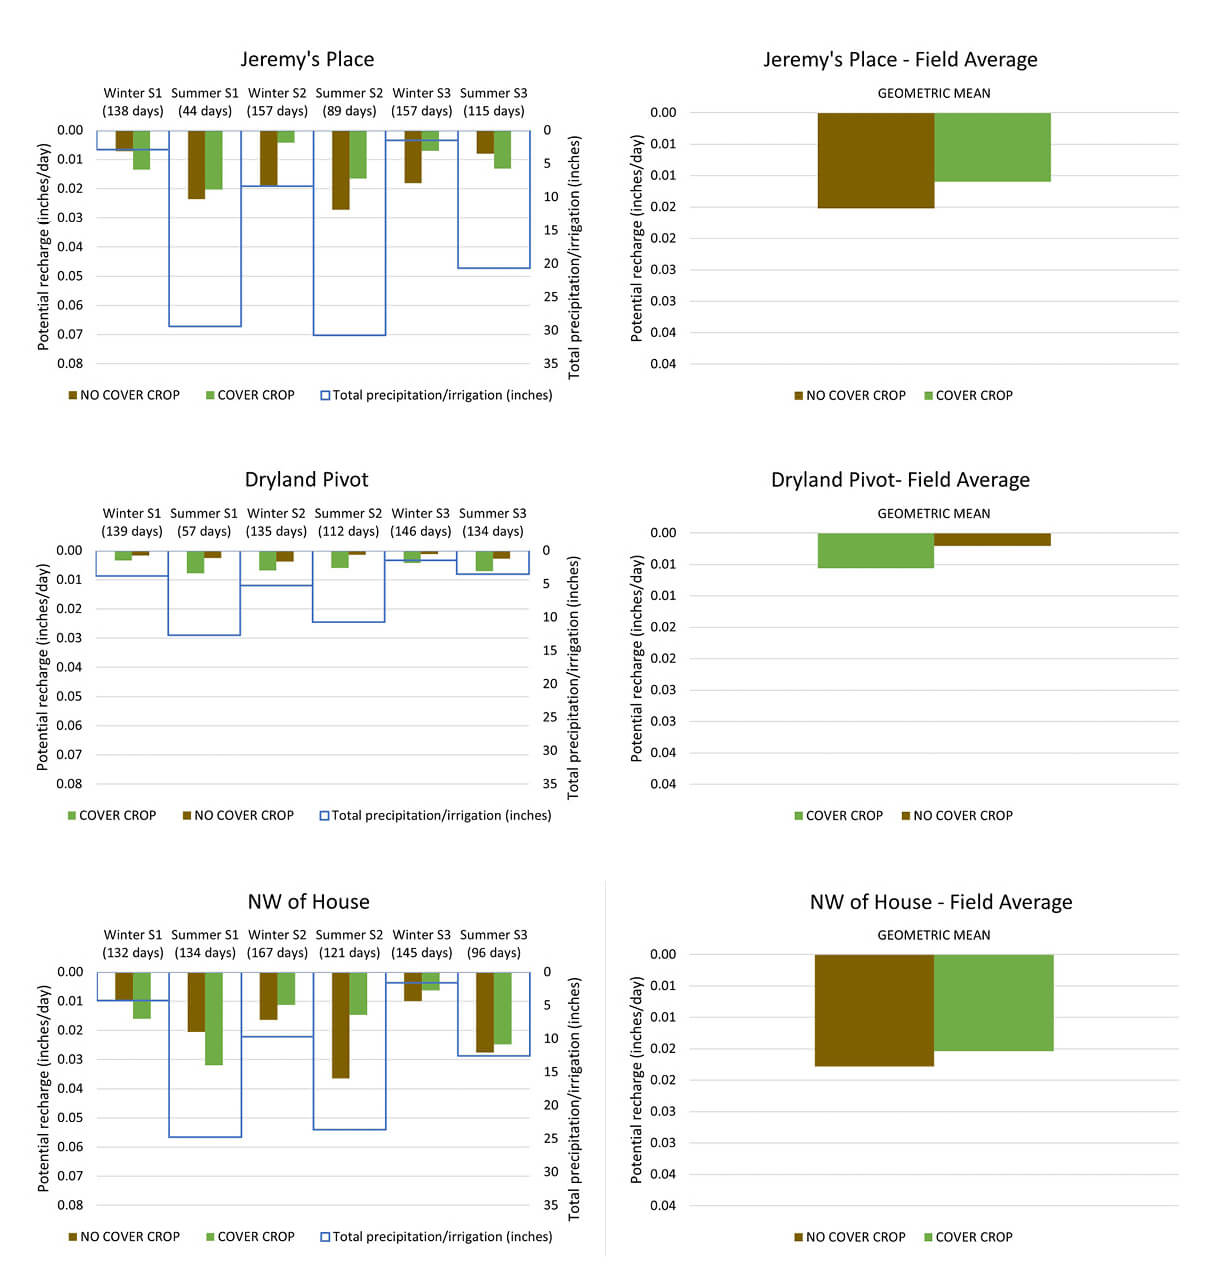
Cover Crop Effects Groundwater Data Collection Graphs
×
Contact Us
Name
First
Last
Email
Comments / Questions
Δ