The accelerated advancement of technologies supporting the collection, management, and analysis of environmental industry data has created an opportunity for organizations to employ new capabilities for more timely, efficient, and accessible project-based collaboration and robust deliverables. Moreover, the rapid rise in popularity of Artificial Intelligence (AI) and Machine Learning (ML) will further impact how environmental organizations, regulators, and industries will apply technology to support their missions.

Watch EA’s Environmental Insights webinar to learn more. A brief summary is presented below.
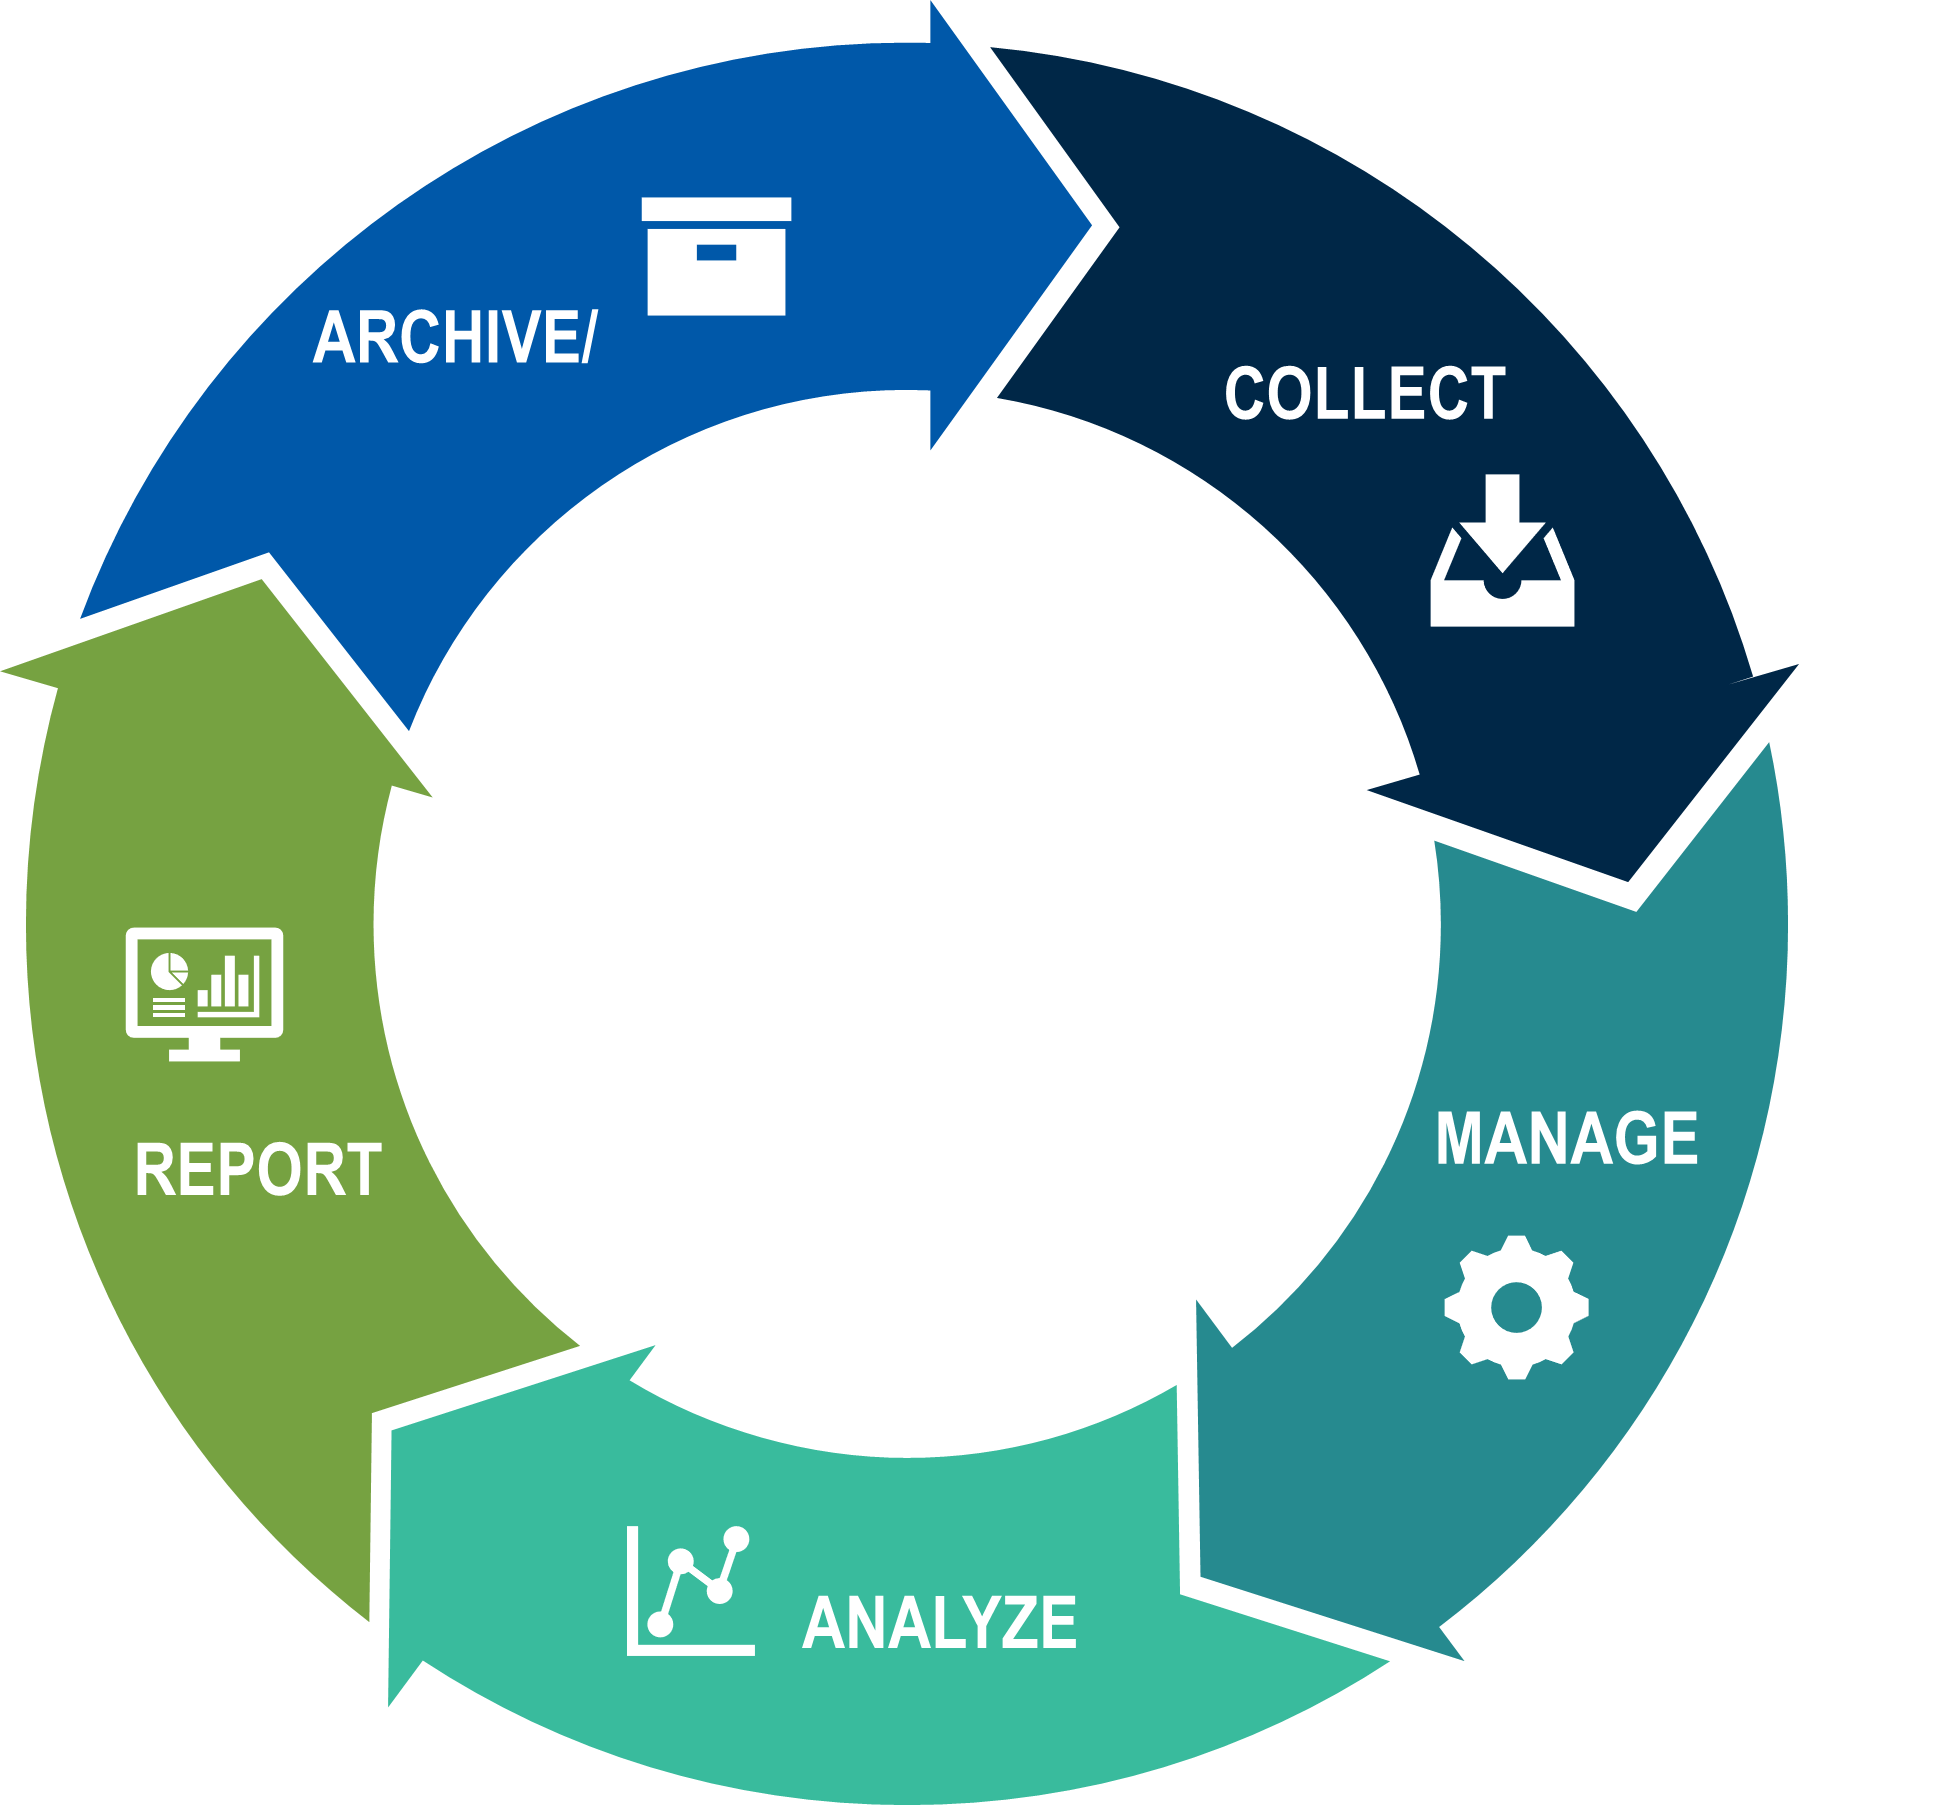
Each phase of the data cycle employs a constantly evolving range of technologies to collect, store, analyze, manage, and report on large volumes of data using less complex equipment and platforms, to provide maximum accessibility.

Data Collection
Data collection efforts are experiencing a transformation in efficiency through both software and hardware innovations. Although mobile devices are not a new technology, the increased usage of no-code and low-code platforms offers scientists the ability to create customized and often complex forms for very specialized use cases in the field, such as inspections, compliance, and geospatial mapping. Remote sensors paired with telemetry offer real-time data capture and transmission via Wi-Fi, cellular, or satellite. Drones are used widely for site reconnaissance and progress monitoring; however, the sensors they carry can expand their functionality to include infrared, thermal, and actual sampling. Together, these technologies can fulfill an array of use cases from documentation to analysis and modeling.

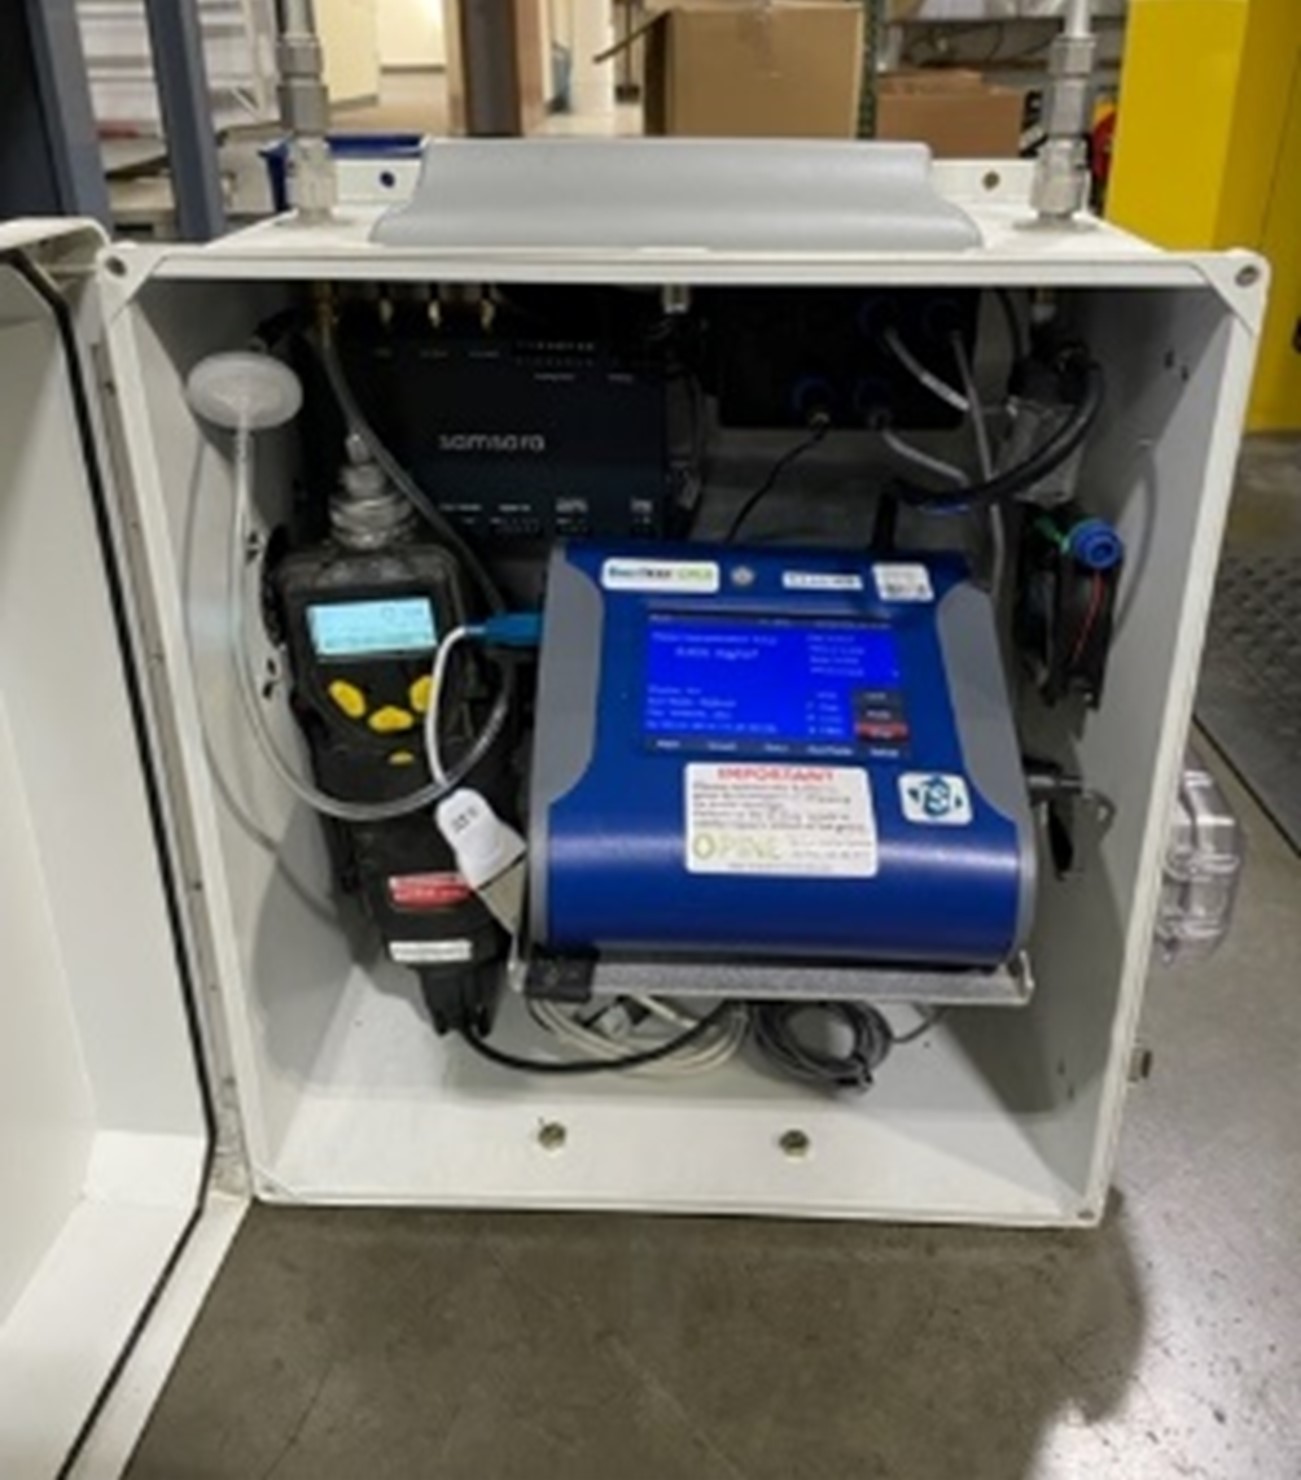
Real-time dust monitoring system
At a remediation site in California, EA is using a series of on-site real-time monitors to capture readings of five criteria every second. Using a cellular-based modem, data are migrated instantaneously to the cloud. A series of alerts using 5- and 15-minute averages are distributed via text, email, and voice to different groups or parties, allowing the team to adjust site activities in real-time.
Data Management
The primary goal of any data management system is to serve as the single course of “truth” for a specific class/type of data in an organization. This approach promotes security, standardization, and normalization of data; creates a foundation for integrated processes; and is a key component of governance. Within the environmental industry, this often involves analytical, geologic, compliance, engineering, and/or asset management data. It is key to determine the standard of care that needs to be maintained to meet the needs of expected users and proposed uses. Key considerations in data management include:
- Embracing specialization to leverage systems designed for the specific class/type of data
- Location (logical, network) for ensuring both security of the data and accessibility of the system by all potential users
- Awareness of underlying infrastructure requirements including dedicated servers and third party database management systems
- Dedicated staff responsible for managing data and platform
- Opportunities for integration with other systems
Data Analysis
Like data collection and management, analysis functions are well established within the environmental industry. Analysis tools can be grouped into three tiers of complexity:
- BASIC: Analysis using familiar summarization and charting such as Microsoft Excel, Access, or BI
- INTERMEDIATE: Visualization that includes options for more stylized presentation and automated generation
- COMPLEX: Physical analysis or modeling for decision support or predictive analysis
Many recent improvements in these tools have focused on improved and simplified interfaces to afford users easier interaction with sophisticated data sets and models. By selecting the right level of complexity, the tool should streamline dissemination, reporting, and analysis.
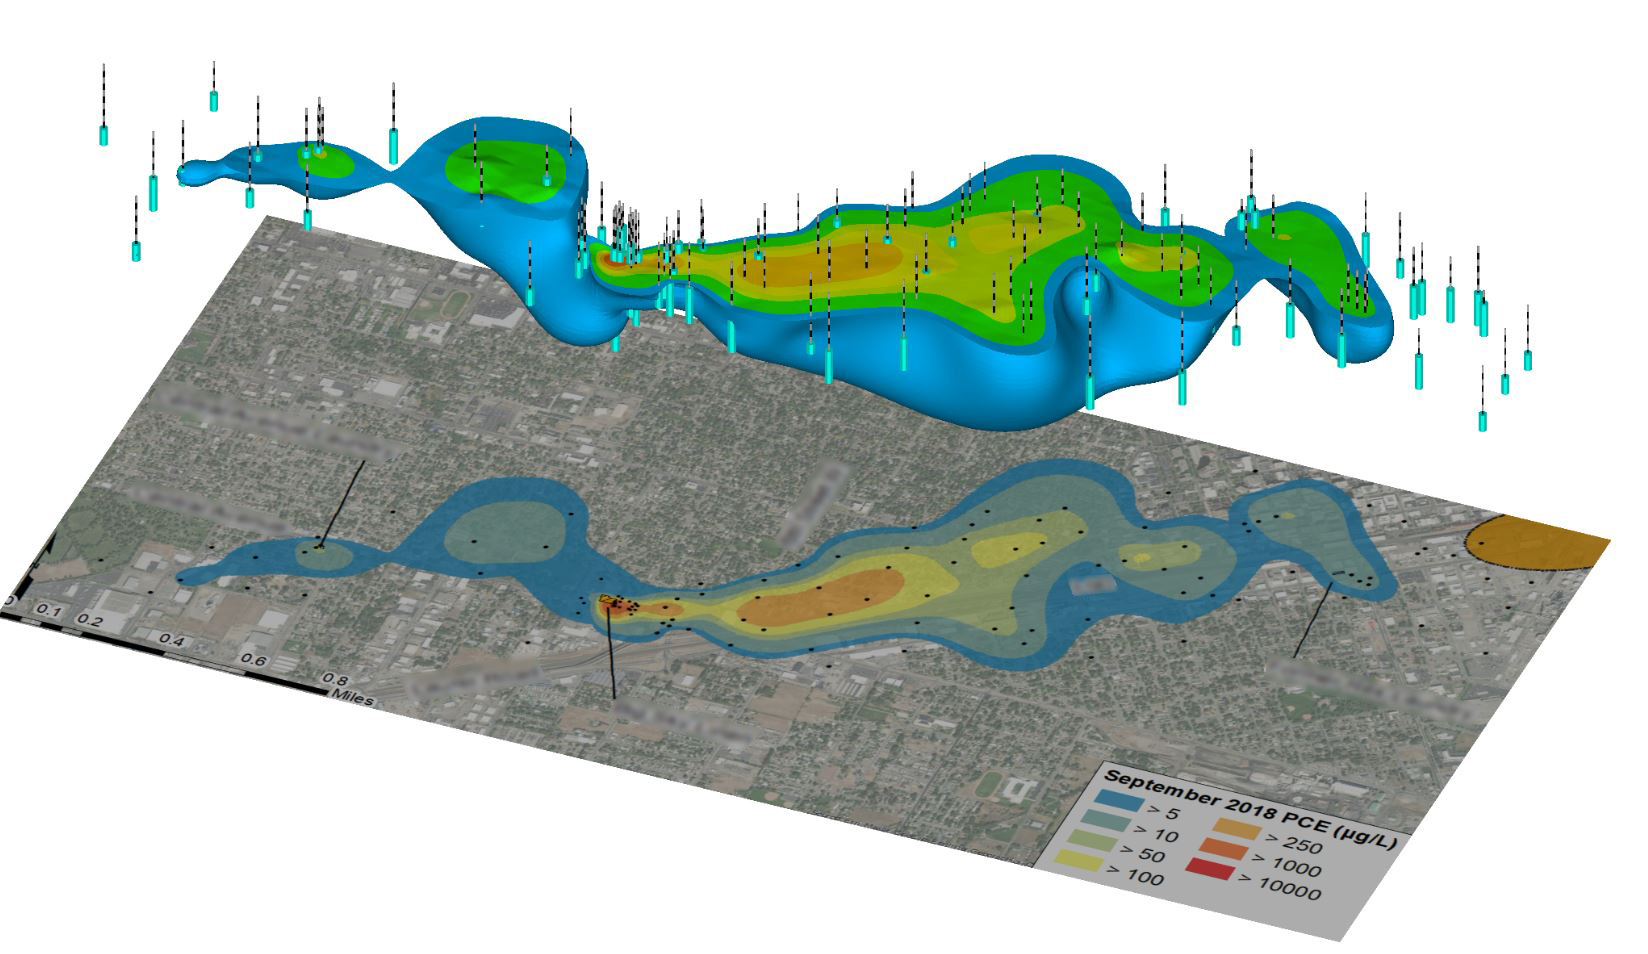
EA utilized plume monitoring optimization techniques to support a large data set related to an expansive urban remediation site that included hundreds of monitoring locations. The goal was to simplify sampling logistics by optimizing the complex well network through reduction of redundancy and uncertainty. To do so, engineers used a combination of two programs. MAROS, a Microsoft Access interface, provided a quantitative rank of wells based on importance to the network (achievement in delineation), which supported identification of redundant wells that, if removed, would not result in a significant loss of information. The EVs Earth Point Metric Studio was used to delineate the plume, which was used to obtain statistical confidence and identify areas of uncertainty on the site. Combined together, the two metrics demonstrated that the same level of plume delineation and confidence could be achieved with 70 wells as opposed to 120, creating an estimated savings of approximately $200,000 in sampling costs over 5 years.

3D Tetrachloroethane (PCE) Groundwater Plume from Three Distinct Source Areas
Data Sharing/Reporting
Changing technology has made great strides in improving sharing, reporting, and collaboration on data through dashboards. Simple, easy-to-navigate web dashboards or portals are the standard for user interfaces. Selection of the right tool is dependent on the data management system in use. Standalone tools such as Microsoft BI and Tableau allow developers/business analysts to quickly create, publish, and analyze visualizations. Other tools facilitate collaboration throughout the data cycle, from real-time field data views to report writing/editing. Project teams should consider the frequency of reporting and updates as well as the intended audience when selecting tools. The data should drive the type of dashboard. Governance for access, sharing, and permissions must be established early.
The Future
The evolution of the technology landscape is continuing to accelerate environmental industry impacts and disruption expected from the latest tools, such as reality capture and AI. With reduced cost and expanding access to light detection and ranging and point cloud generation, now available on mobile phones and drones, three-dimensional (3D) models can be created at sites without the need for specialized equipment or certification. Processing the immense amount of data processing has become both more sophisticated and easier to navigate.
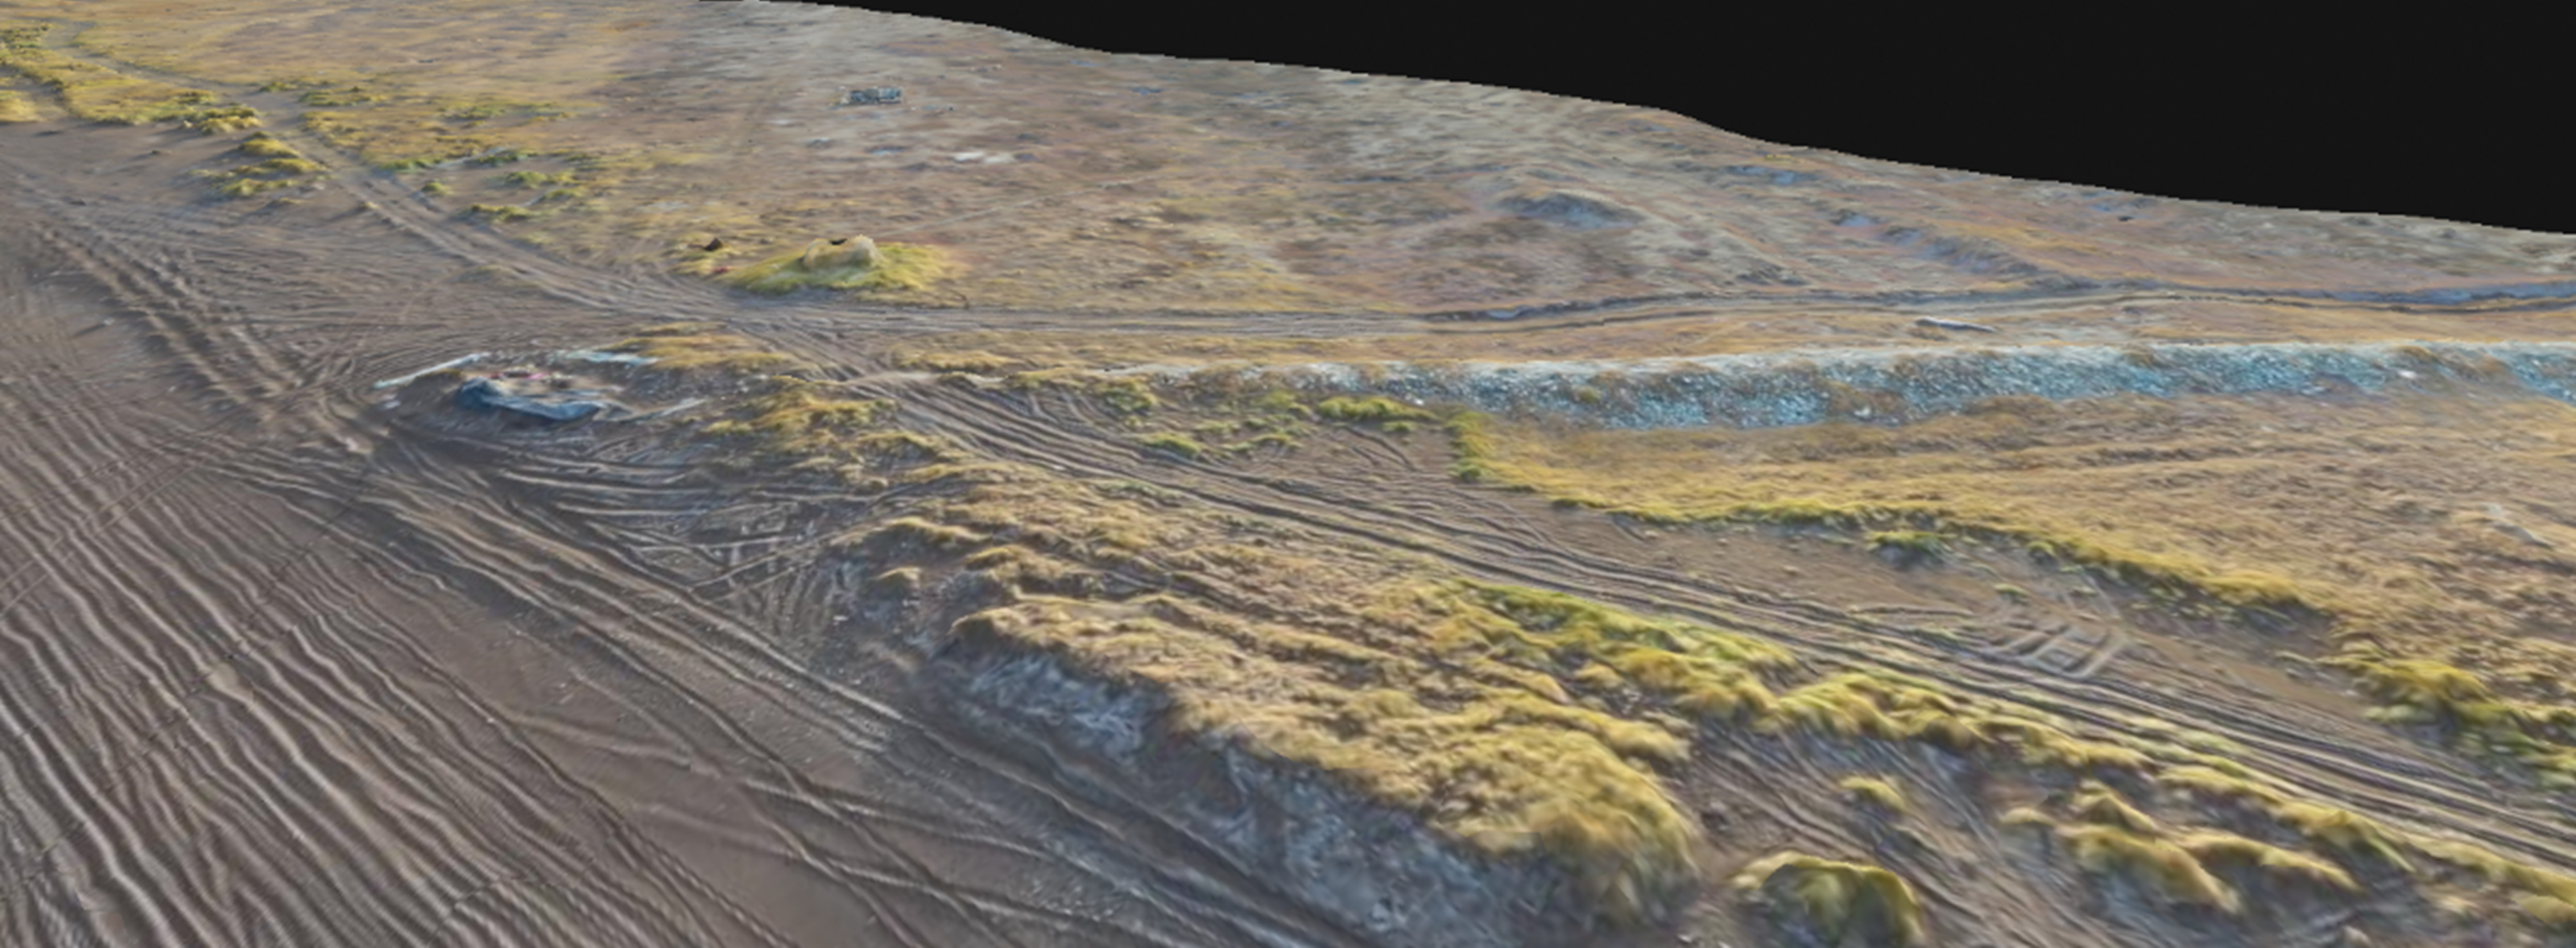
In the Alaskan city of Point Hope, EA scientists are building 3D models based on point cloud data captured via drone to visualize and monitor coastal erosion that is endangering traditional infrastructure—ice cellars—and cultural and historic landmarks. Data were captured using a drone and are now available to the public using a 3D web viewer.

Point Cloud Generated Aerial of Coastline in Point Hope, Alaska
Generative AI continues to be a hot topic in the mainstream media. These large language models, like ChatGPT, offer a wealth of possibilities such as creation of meeting summaries, contract review, editing, and training. This includes computer vision to generate and classify images or detect options. Risks and considerations include accuracy of generated data due to bias and hallucinations as well as legal and regulatory concerns. Implementation of private, large language models behind an organization’s firewall will help mitigate some of these risks.
 For More Information, Contact:
Jason Samus
Director of Technology Solutions and Lead Quality Technical Chief for Information Technology and Data Management
Contact Us
